Appendix 3. Long Exposure (6x) Scan Databases, Catalogs and Images
6. 6x Catalog Generation
b. Scan Selection
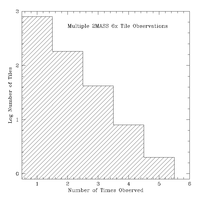
Final processing of the 2MASS 6x data yielded 1328 scans of 1030 tiles taken under nominally photometric conditions. Most 6x tiles were observed once. 233 (22.8%) were scanned multiple times, as shown in Figure 1, with a few being observed as many as five times.
The first step in generating the 6x point and extended source catalogs (6x-PSC and 6x-XSC) is to select the set of scans that provide one unique coverage of each tile. The selection process is identical to that used to prepare the All-Sky PSC and XSC that is described in V.2:
- Tiles with only one scan available are first selected. There are 798 such tiles.
- For the 223 tiles with multiple scans, one scan of each tile is selected according to the following criteria:
- Select the scan with the highest quality score, as assigned during final 6x data processing.
- If there is more than scan of a tile with the same best quality score, the scan with the best net relative sensitivity (V.2) is selected. The net relative sensitivity, defined in V.2, is a relative ranking of the photometric sensitivity for a group of observations of the same tile that is based on atmospheric transparency, seeing and background values.
This procedure yields 1030 scans from which to draw sources for the 6x-PSC and 6x-XSC. Of these, 371 scans cover non-LMC/SMC fields and are included in the initial Extended Mission Data Release. The Catalogs from the 659 LMC/SMC scans will be released in 2007. Scans that are selected for generation of the 6x Catalogs are identified in the 6x Scan Information Table by having a value of cat="1".
 |
| Figure 1 - The frequency of observation for all 6x tiles |
The Effect of Duplicate Tile Numbers
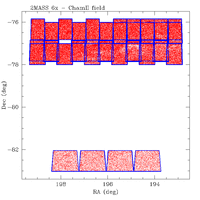
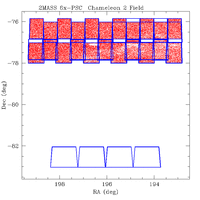
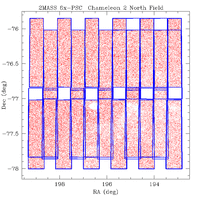
Several scans in the Chameleon 2 and Hydra 6x fields were incorrectly labeled with the same tile number even though they did not cover the same region of sky. This duplication led to the omission of several scans and parts of scans from the 6x Catalogs because scan selection was driven by tile number. Figures 2 and 3 show the spatial coverage of all 6x scans (in blue) of the Chameleon 2 field. 6x-PSWDB extractions are shown by the red points in Figure 2, while 6x-PSC source are shown in Figure 3. The 6x-PSC excludes the four southern scans because they have the same tile numbers as scans covering the northern section of the field, and the northern scans were taken under more favorable atmospheric conditions. Figure 4 illustrates additional area omitted in the northern section of the field where other duplicate tile numbering occurred.
Although some area in these fields has been omitted from the 6x Catalogs, the extractions are included in the 6x-PSWDB and 6x-XSWDB.
There are four scans selected for 6x Catalog generation that were assigned very low quality scores (Q=1) because of periods of untracked seeing. These four scans are identified Table 1. Untracked seeing refers to times when the PSF was changing due to atmospheric seeing faster than it could accurately monitored and characterized by the data reduction software (see IV..5.a.v). These observations were taken during nominally photometric conditions, but the extracted source data may have unquantified photometric biases and there may be mis-identified extended sources in short sections of the scans. The quoted photometric uncertainties in the affected regions may not reflect the true errors caused by the mis-characterized PSF. These four scans are identified Table 1.
| Tile | scan_key | Date | Hemis. | Scan | 6x Field |
|---|---|---|---|---|---|
| 24335 | 2847 | 06/04/2000 | n | 14 | Lockman Hole |
| 24341 | 2829 | 05/24/2000 | n | 22 | Lockman Hole | 34756 | 3049 | 11/18/2000 | n | 16 | Perseus/NGC1333 |
| 303074 | 3115 | 11/06/1999 | s | 42 | Test1 |
[Last Updated: 2007 January 8; by R. Cutri]
Previous page. Next page.
Return to Explanatory Supplement TOC Page.


