VI. Analysis of the 2MASS Second Incremental Release Catalogs
7. Comparison to External Catalogs and Models
e. External Checks of 2MASS Galaxy Magnitudes
There are several ways to provide external checks on the 2MASS galaxy magnitudes. The first and simplest is to compare the galaxy aperture magnitudes with published data. Currently there are just a few major sources of near-IR aperture photometry for galaxies:
- The Aaronson et al. (1979, ApJ, 229, 1; 1982, ApJS, 50, 241;
1986, ApJ, 302, 536) data for IR Tully-Fisher studies
which are currently in a datafile at CfA and are
aperture data obtained with a single element detector in a wide field
photometer on a large variety of telescopes in the late 1970's and early
1980's
- The Peletier, Willner, Raychaudhury et al. data on Virgo and Ursa Major
obtained with a small array detector
- The cluster galaxy data from the Bologna group (e.g., Gavazzi et al. 1990,
A&AS, 86, 109; Scodeggio et al. 1992, A&AS, 94, 299), mostly obtained at
Asiago with a small array detector
- Cluster galaxy data from ESO, also obtained with a single element
photometer (e.g., Boisson et al. 1993, A&AS, 100, 583)
- Photometry from the group at UNAM (e.g., Recillas-Cruz et al. 1991,
A&A, 249, 312) and
- The Moriondo et al. (1999, A&AS, 137, 101) data for galaxies in the Pisces-Perseus region.
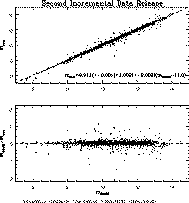
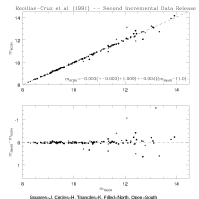
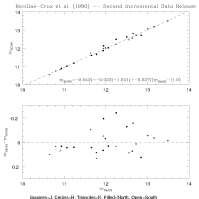
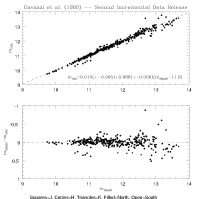
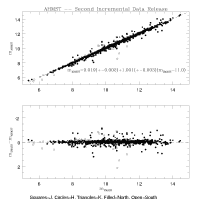
We have begun to compare the 2MASS aperture photometry from the data releases with these literature results. There is remarkable agreement between the 2MASS magnitudes and the literature magnitudes, even at faint magnitudes. The observed dispersion is consistent with the quoted errors and the slope is very close to unity.
The bottom of this page will contain a number of figures for the Second Incremental Data Release, including individual comparison with each published J, H, and/or K photometric data set.
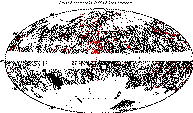
For all of the comparison plots on this page, individual galaxies may appear
more than once if there are more than one magnitude or aperture size given in
the literature. Therefore, the number of points in the plots do not represent
the number of galaxies used in the comparison. This can be seen in
Figure 1, where
the black points represent the data in the Release with
Ks  12.2 mag, and the red points are
those galaxies used in the magnitude comparisons.
|
| Figure 1 |
In Figure 2 is the combined comparisons between the published data and the Release.
|
| Figure 2 |
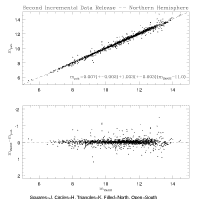
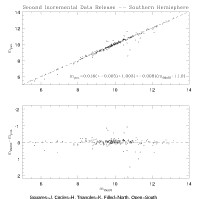
In Figures 3 and 4 is a comparison between the northern and southern hemispheres, respectively, for the Second Incremental Data Release. The data from the two telescopes is in very good agreement, the offset between the two being about 0.01 magnitudes.
|
|
| Figure 3 | Figure 4 |
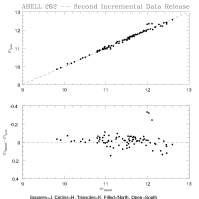
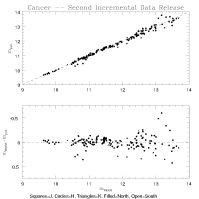
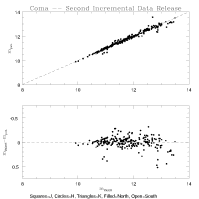
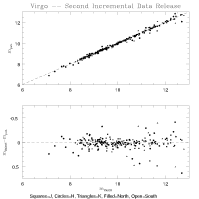
Below in Figures 5-8 are specific comparisons for several galaxy clusters:
|
|
|
|
| Figure 5 | Figure 6 | Figure 7 | Figure 8 |
| Abell 262 | Cancer | Coma | Virgo |
Below is a breakdown for each set of published data:
- Figure 9; Peletier & Willner (1993, ApJ, 418, 626) -- H photometry obtained with the 1.2m telescope at FLWO
- Figure 10; Boisson et al. (1993) -- JHK photometry obtained with the 1m and 3.6m telescopes of the European Southern Observatory
- Figure 11; Scodeggio et al. (1992) -- H photometry obtained with the 1.5m Infrared Telescope at Gornergrat (TIRGO)
- Figure 12; Peletier & Willner (1991, ApJ, 382, 382) -- H photometry obtained with the 0.6m telescope at FLWO
- Figure 13; Recillas-Cruz et al. (1991) -- JHK photometry obtained with the 2.1m telescope of the Mexican National Astronomical Observatory
- Figure 14; Recillas-Cruz et al. (1990, A&A, 229, 64) -- JHK photometry obtained with the 2.1m telescope of the Mexican National Astronomical Observatory --
- Figure 15; Gavazzi et al. (1990) -- JHK photometry obtained with the 1.5m Infrared Telescope at Gornergrat (TIRGO)
- Figure 16; Aaronson et al. (1982, 1986) -- comparison with the well known aperture photometry for the IRTF project. The points that are high (2MASS is bright by ~0.75 mag w.r.t. these data) are due to three galaxies: N1156, U4332, and U4400. For N1156 there are two other measurements (J and K bands) that are in excellent agreement with 2MASS; it is only the H band that is off. The Aaronson et al. colors are reasonable; it is the 2MASS colors that seems to be off. For U4332, the colors in both sets of data are reasonable, but there is an offset of about 0.7 mag between 2MASS and Aaronson et al. The points that are low in the comparison are due to U4375 and U4416. For U4416, there are multiple H-band measurements by Aaronson et al., which are in good agreement.
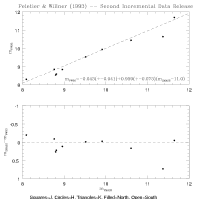
|
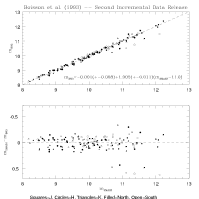
|
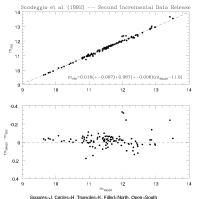
|
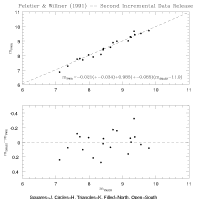
|
| Figure 9 | Figure 10 | Figure 11 | Figure 12 |
|
|
|
|
| Figure 13 | Figure 14 | Figure 15 | Figure 16 |
[Last Updated: 2000 January 26 by J. Huchra and J. Mader. Modified 2000 Aug 29 by S. Van Dyk.]
Previous page. Next page.
Return to Explanatory Supplement TOC Page.