Notes about the Far Infrared Line Mapper (FILM) Data in IRSA IRTS
database (S. Lord, May 2004)*
-----------------------------------------------------------------
WHICH CHANNELS ARE PRESENT IN THE FILM DATA ?
In its design, the IRTS FILM instrument has 4 channels, one
channel devoted to the 63um (158.4 cm-1) [OI] line and the
other three associated with the 157.7 um (63.4 cm-1) [CII] line.
The three channels associated with [CII] consist of a central
channel of higher resolution, (R=409), and two side
channels to measure baseline continuum at 155.27 um (R=130)
and 160.2 um (R=130).
Data from only two of
these four channels are present in the IRSA/IPAC file set: 1)
the "line data " from the [CII] 157.7 um
detector and 2) the continuum background data from the
155um detector.
WHAT IS THE SPECTRAL RESOLUTION, THE SPATIAL RESOLUTION,
AND SAMPLING?
The spectral resolution of the central CII channel is R=409 which
spans 733 km/s and thus the full range of Galactic disk
velocities.
The spatial resolution of a single pixel is 8' x 13', where
13' the resolution in the "in-scan" coordinate direction. The
sampling of pixels is Nyquist - pixels are displaced
approximately every 4' in the in-scan and cross-scan directions.
Over several orbits a multi-strip map was built up. These strips
are seen in each observing box. [Note: the term "observing box"
is not the official nomenclature of the IRTS mission but a term
invented for these pages.] The observing boxes are represented by
the 88 red squares in the IRSA IRTS
image main window and are 12.8 degrees on a side.
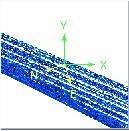
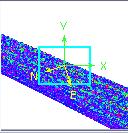
We picture an observation below with detector tracks going across
it. The data are resampled into the closest 4'x4' pixel within
the 192 pixel x 192 pixel observing box. The box is oriented in
galactic (long.., lat.) which is shown as (x,y) on the axes
below. The RA and Dec direction is given by the N,E
arrows. The box width is 12.8 degrees on a side. There are
about 88 such independent boxes. The boxes overlap. If you click
on a position using the IRSA Atlas service that is in the overlap
region, the files for both boxes will be listed.

DATA UNITS
We draw the following conclusions by looking at the comments for
the keyword BUNIT in the headers of the intensity maps' FITS
files:
The CII Channel is in units of delta_lambda (of the detector) x
Intensity_lambda yielding W/m^2/sr
The 155 um Channel is in units of lambda (i.e. 155 um) x
Intensity_lambda again yielding W/m^2/sr
Thus to convert the 155 um channel to a flux density one would
multiple 8'x13' in sr (8.8 10^-4) and divide by 155 which would
yield W/m^2/um
HOW ARE THE DATA ARRANGED?
There are typically nine FILM files associated with a
particular observing box.
(This is true for all observing boxes except three: the square at
(84deg RA, 27deg Dec) has ten 155 um files and four CII files.
The square at (286deg RA, 17deg Dec) that has only five 155 um
files, and it lies next to a square at (295 deg RA, 1.4deg Dec)
that has only four CII files.)
When you select a position, these nine files will be listed,
available for display or downloading. Four files will be
associated with the CII detector, and five will be associated
with the 155um continuum detector.
It convenient to distinguish these files from each other in two
steps:
First, the CII 158 um line data are found in files with a
directory path such as:
MAPS/FILM/CII/
The 155 um files are found in the path such as
MAPS/FILM/155UM/film_155_fits/ or
MAPS/FILM/155UM/film_155_intp/
When downloading files, you may wish to separate these files into
two directories or rename them, because you will not be able to
distinguish
the CII and 155 um data by the filenames.
The second step is to look at the keywords of the FITS header
within the file to see which type it is. We list the nine
different types of FILM files below.
The files are FITS images, such as the image above, which can be
viewed with utilities such as OASIS, ds9, etc..
We list the four CII files in
order and give the important identifying keywords:
CII File 1) Samples per pixel
Map
BUNIT =
'
' / # of
samples in a pixel
COMMENT The IRTS/FILM [CII]-line channel sample
number in a pixel
This is the number of samples taken that fell into a particular
pixel that were used to calculate the pixel value (not
interpolated by surrounding pixels). The number typically ranges
between 1-4, with 39 indicating no data in a pixel, and the count
reaching as high as 20 where the orbit scan tracks are crowed
together.
CII File 2) Raw Intensity
Map
BSCALE = 01E-13 /
TRUE=TAPE*BSCALE+BZERO
BZERO = 00E+00 /
COMMENT The IRTS/FILM [CII]-line intensity map
BUNIT = 'W/m**2/sr' / Intensity
(DELTA-LAMBDA*I-LAMBDA) for line
These line fluxes are a fundamental product of the mission. I
believe the CII detector data here has had the scaled 155 um
continuum removed since the intensities take negative excursions,
but I am by no means sure. This is a significant point
since at 158 um the Line/Continuum can be on the order of unity.
Therefore, this possibility should be checked. Further,
given the the resolution is quoted as 8'x13' I believe the
conversion to W/m**2 should involve a multiplication by:
8.8 10^-4.
CII File 3) Interpolated Intensity Map
BSCALE
=
01E-13 / TRUE=TAPE*BSCALE+BZERO
BZERO
=
00E+00 /
BUNIT =
'W/m**2/sr'
/ Intensity (DELTA-LAMBDA*I-LAMBDA) for line
As shown below, the line intensities have been interpolated and
extrapolated to fill in the gaps between scans. Presumably the
algorithm used is that one specified in the fifth 155 Fits files
discussed below. We do note that in the way that the gaps have
been are filled-in, hot adjacent pixels can dominate and
systematic high intensity structure can sometimes be seen to
result.

CII File 4) Dispersion Error Map
BSCALE
=
01E-13 /
TRUE=TAPE*BSCALE+BZERO
BZERO
=
00E+00
/
BUNIT =
'W/m**2/sr'
/ Error for line
This error value seems to be a 1 sigma dispersion between the
values combined: it is zero when only one data point was used to
form the pixel. The error map applies to the intensity map (File
2) not the interpolated intensity map (File 3).
We note that the FITS header variable CDELT2 has a sign inversion
between the CII and the 155 um which causes the maps appear
flipped in the observing box when compared with each other.
155 um File 1)
Samples per pixel MAP
BSCALE
=
1.000E+00 /
TRUE=TAPE*BSCALE+BZERO
BZERO
=
0.000E+00
/
BUNIT = 'NUMBER
' / The
Number of data in pixel
This is again the number of 155 um samples falling into a pixel.
Here there are more than in the CII case, and never just 1. The
number ranges into the 40 and the value 86 represents no
data.
155 um File 2) Raw Intensity
Map
BSCALE = 1.000000000E-11 /
TRUE=TAPE*BSCALE+BZERO
BZERO = 0.000000000E+00
/
BUNIT =
'W/m**2/sr'
/ Intensity (LAMBDA*I_LAMBDA)
155 um File 4) Interpolated Intensity
Map
BSCALE
= 1.000000000E-11 /
TRUE=TAPE*BSCALE+BZERO
BZERO = 0.000000000E+00
/
BUNIT =
'W/m**2/sr'
/ Intensity (LAMBDA*I_LAMBDA). This image
is
/ including interpolated pixel values.
155 um File 3) Dispersion Error Map
Notice the BSCALE value is lower for the error map- the FIR 155
um continuum is detected with
significantly higher S/N than the CII line emission.
BSCALE = 1.000000000E-12 /
TRUE=TAPE*BSCALE+BZERO
BZERO = 0.000000000E+00
/
BUNIT =
'W/m**2/sr'
/ Error of Intensity
(LAMBDA*I_LAMBDA)
155 um File 5) Interpolation
Method Map
The larger pixel boxes below are used
when there are larger gaps between scans.
BSCALE
=
1.000E+00 /
TRUE=TAPE*BSCALE+BZERO
BZERO
=
0.000E+00
/
BUNIT = 'INDEX
NO' /
The number of the interpolation index
DATAMIN
=
0 / # of the interpolation
index
DATAMAX
=
3 / 0 : Original
Intensity
/ 1 : The value is linearly interpolated
from
/ the nearest 3x3 pixel
box
/ 2 : The value is non-linearly
interpolated
/ from the nearest 5x5 pixel
circle
/ 3 : The value is non-linearly
interpolated
/ from the nearest 7x7 pixel
circle
CALIBRATION
An initial assessment of LWS CII calibration was made by Mayiuti
et al. (1997) who site a calibration uncertainty of 40% for the
CII fluxes. They find IRTS measurements
are 0.7 and 0.5 as much as those of a balloon mission BICE and
COBE/FIRAS
* These note have been prepared by reading the papers below and
looking at the data products.
The author is responsible for all errors.
The best source of definitive pre-launch information about FILM
(the Far Infrared Line Mapper)
aboard the IRTS satellite is found here:
"Far-Infrared Line Mapper (FILM) on the Infrared Telescope in
Space" Shibai, H. et al. 1994, ApJ 428, 377
For an initial look at the post-mission CII data, and for
calibration against other observatories the following reference
is useful:
"[CII] line observations of the Galactic Plane by the IRTS/FILM,"
Makiuti, S. et al. 1997, in "Diffuse Infrared Radiation and the
IRTS, ASP Conference Series, Vol 124. H. Okuda, T. Matsumoto, and
T. L. Roellig, eds..

