[C II] 158 μm and [N II] 205 μm emission from IC 342
Date
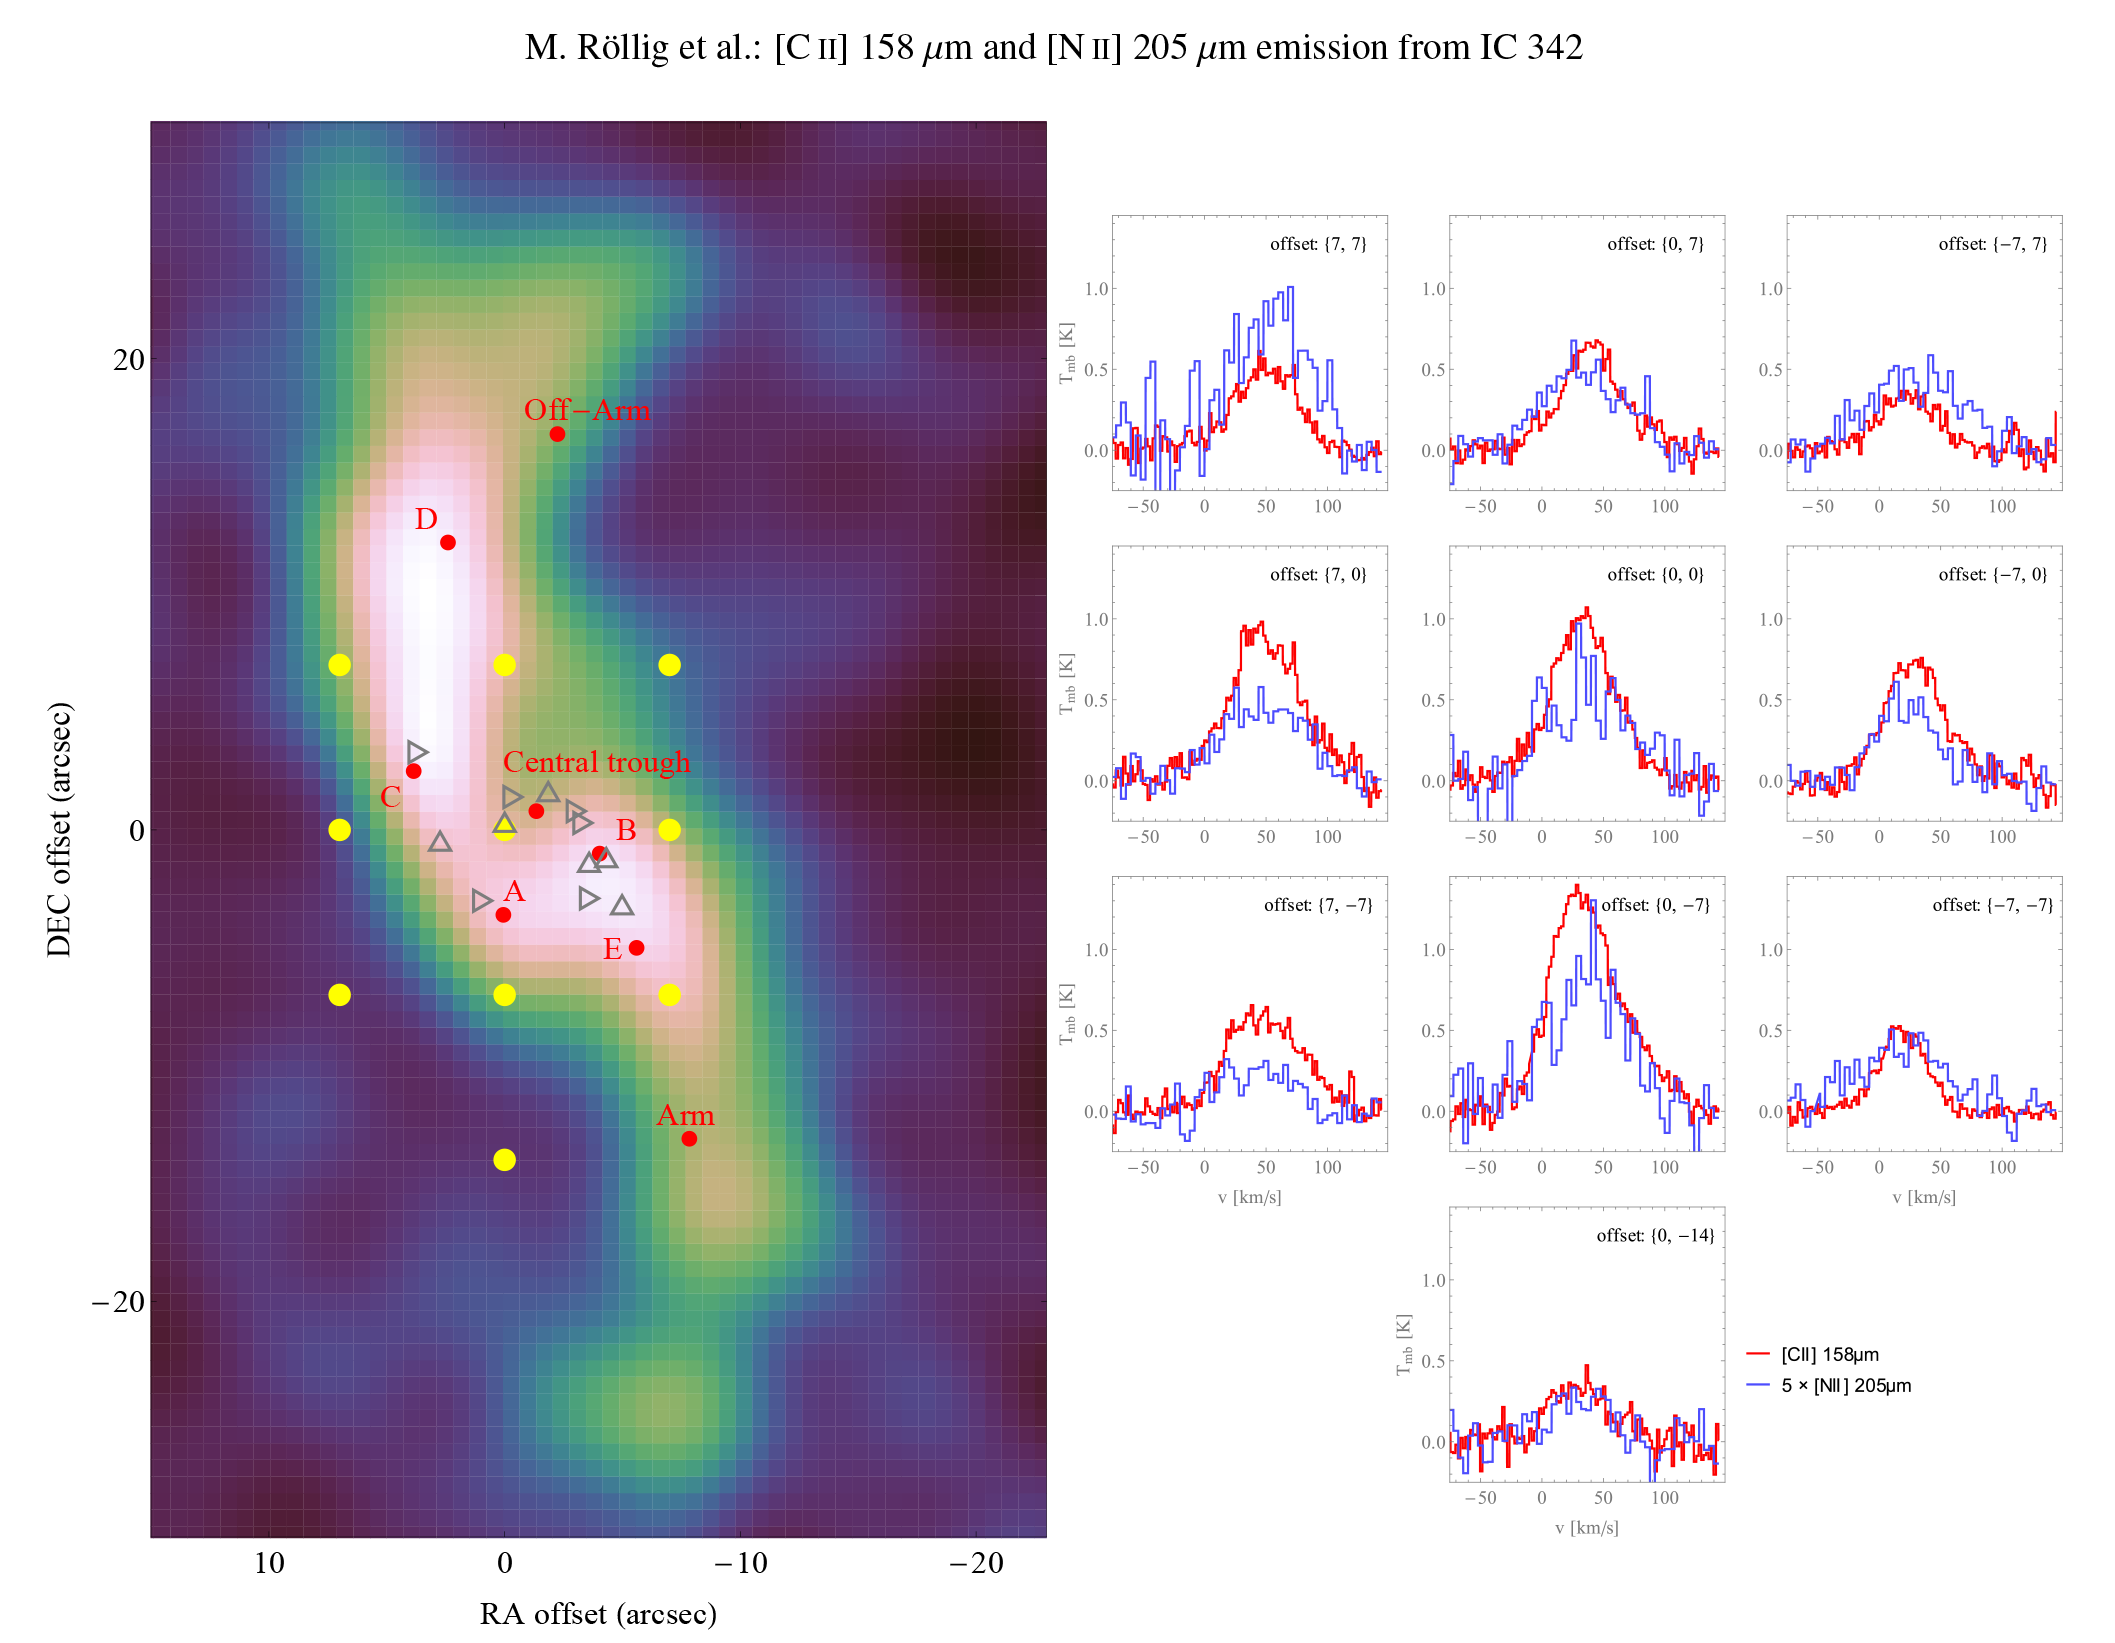
Line-integrated map of the 12 CO(1-0) transition from the BIMA-SONG sample. The yellow points show the observed GREAT positions in IC 342. The (0, 0) position corresponds to (RA, Dec) (J2000) (03:46:48.5 68:05:47). The red points indicate named GMCs and other structures according to Table 3 in Meier & Turner (2001). Triangles facing up and right indicate HII regions and super nova remnants, respectively, as given by Tsai et al. (2006). The [C II] and [N II] spectra are shown on the right side. The [N II] intensity scale is multiplied by a factor of 5.
Credit
(Röllig et al.)
Image Number
SCI2017_0006
Additional Information
[C II] 158 μm and [N II] 205 μm emission from IC 342
Principal Investigator
Markus Röllig
Instrument
GREAT
Location
United States
More Information