Feedback Source Sample
Date
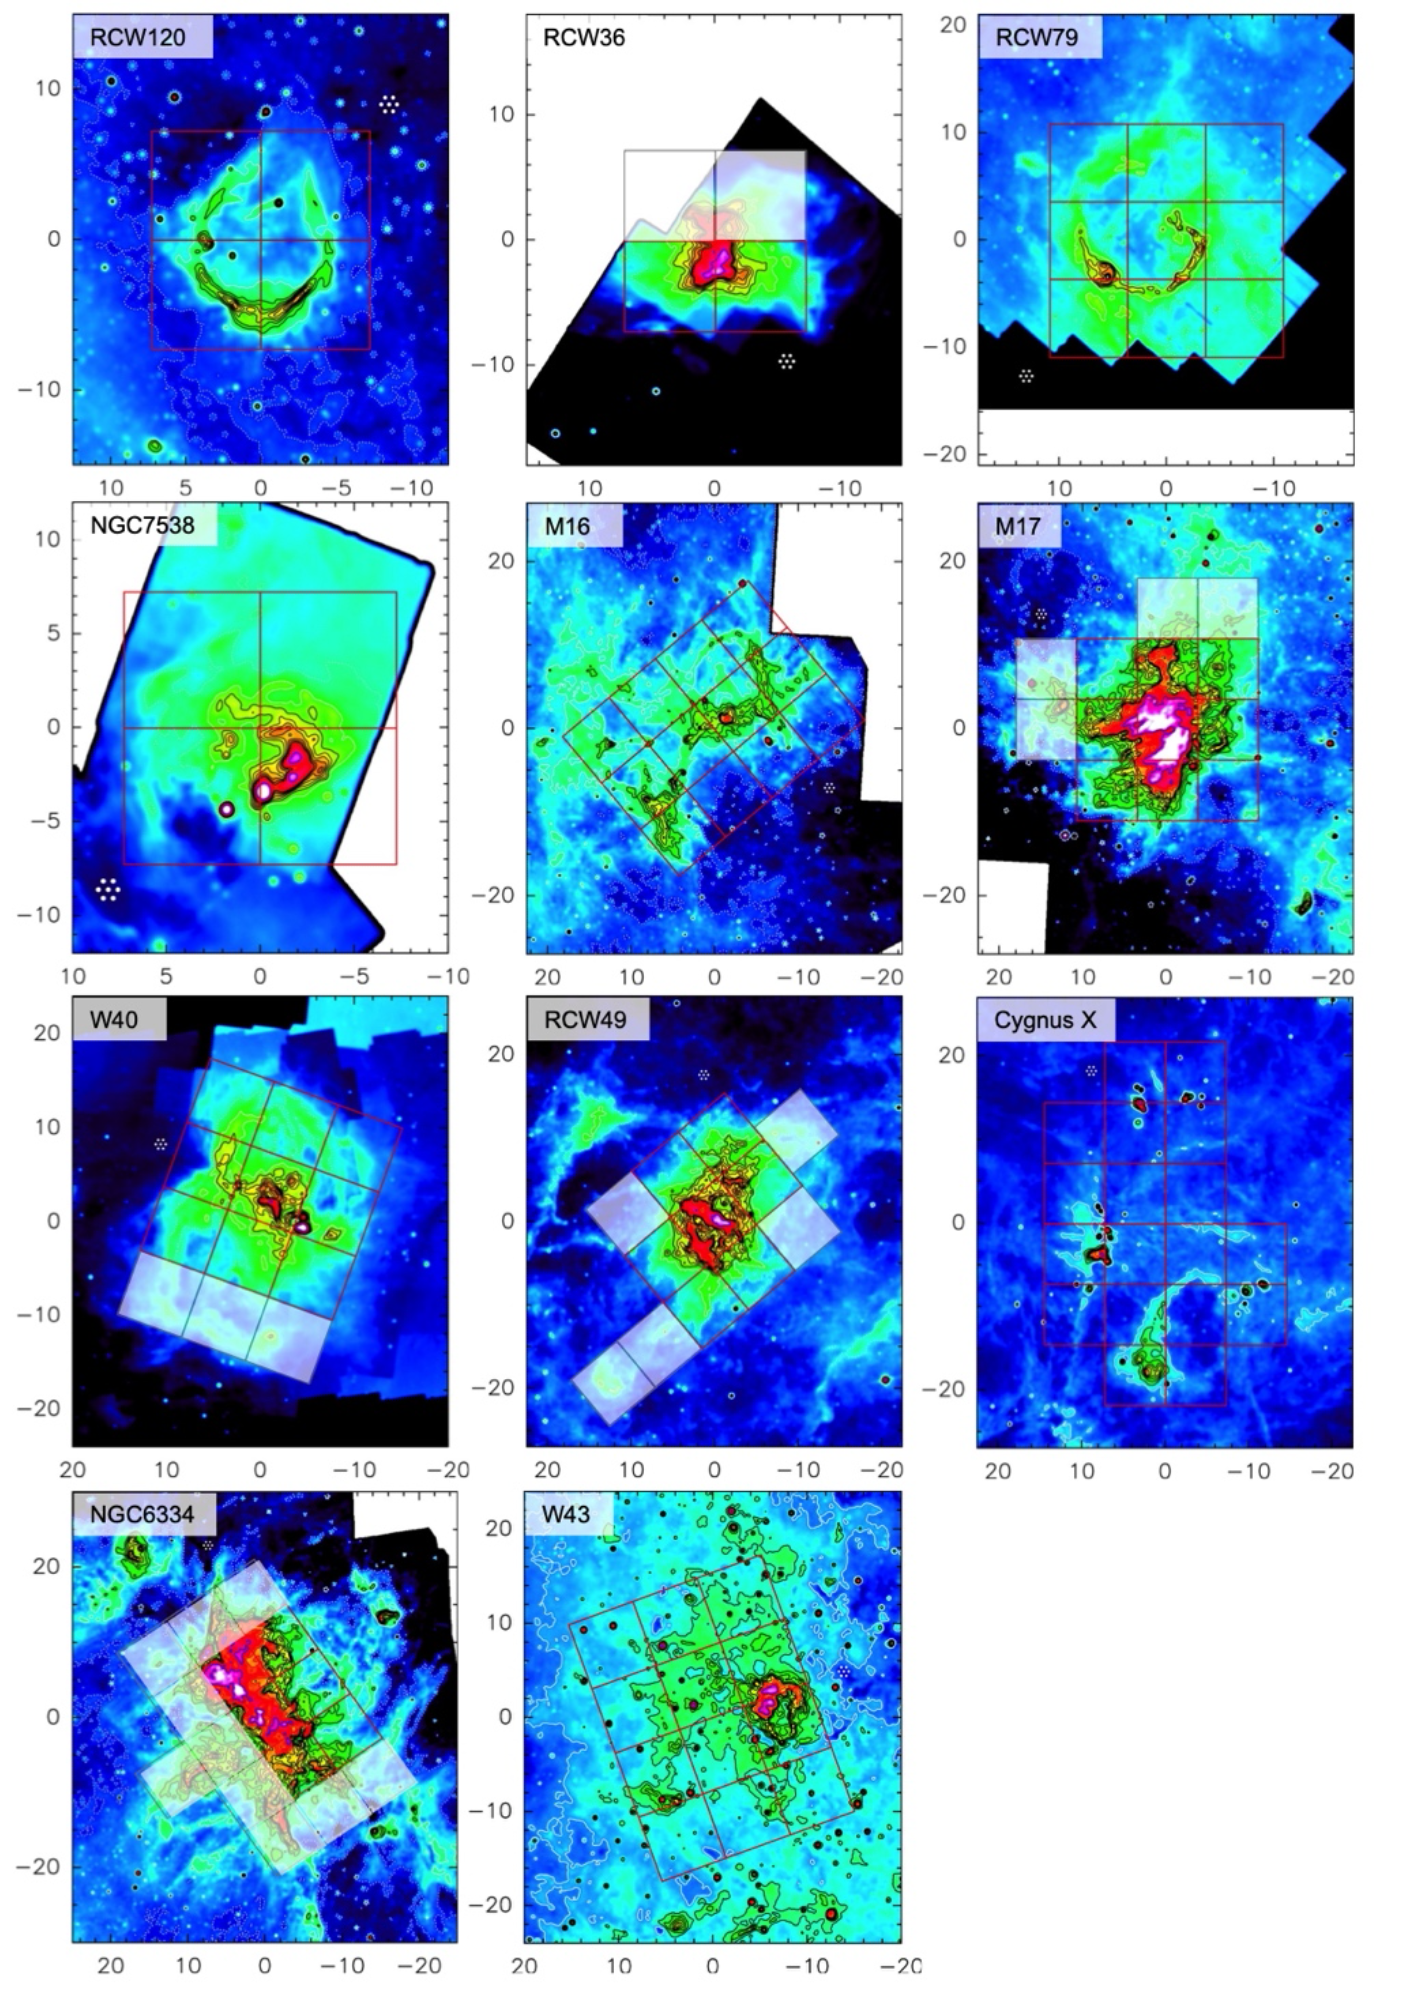
Feedback source sample. The red boxes outline the tiles proposed to be observed for each source. The slightly opaque ones were not observed. Colored background: The IRAC 8μm map of the sources tracing the PDRs in these regions convolved to the 14” upGREAT beam. Contours are predicted [CII] 1.9 THz integrated line intensity based upon the [CII]-8 μm relation derived for L1630, Orion, and 30 Dor. Contour levels are: white dashed (50 K km/s), white (100 K km/s), black (150(50)400 K km/s), red (500 K km/s), blue (1000 K km/s). Box units are in arcmin. The upGREAT 7 beam pattern is plotted alongside the outlined area in each box, illustrating that much finer detail than visible in these images can be traced.
Credit
Robert Simon, University of Cologne
Image Number
SCI2022_0026
Additional Information
Feedback Source Sample
Instrument
GREAT
More Information